Investigating process parameter mechanism for successful scale-up of a hot-melt extrusion process
Posted on May 16, 2014
Introduction
Hot melt extrusion (HME) is a suitable process to produce a wide range of pharmaceutical dosage forms, like tablets, capsules, lozenges or implants. HME can be used for immediate release as well as for sustained release formulations.
Like freeze drying or spray drying the melt extrusion process is used to achieve solid dispersions, what means that the drug is embedded in a polymeric carrier. In this solid dispersion the drug can be dispersed into the crystalline or amorphous state or it can be dispersed on a molecular level in the polymer. In case of a molecular dispersed drug in the carrier this solid solution may result in an increase of solubility, dissolution rate and also the bioavailability. Because of more and more poorly soluble drugs coming from the high throughput screening of drug development departments into the formulation development laboratories, the hot melt extrusion process is rapidly gaining interest.Since melt extrusion is still a relatively new process for the pharmaceutical industries it is more often used for formulation development than in the production environment yet. To handle such a continuous melt extrusion process it is absolutely necessary to understand the influence of the variables process parameters on the resulting process parameters and your final product. [1, 2]
The purpose of this work was to get a deeper understanding of the influence of process parameters on the residence time distribution of the material within the extruder and the specific mechanical energy consumption (SMEC) and to determine the possibilities of up scaling this process from a lab scale to a production line extruder. To save development time and material the opportunity of predictability of the scale up step was determined with a design of experiments approach. Therefore Soluplus® was extruded on three different sizes of co-rotating twin-screw compounder, in different process settings following a design-of-experiments plan. As important process parameters, the residence time distribution was measured with a tracer in each setup and the specific mechanical energy consumption were calculated. Beside these special process parameters all standard parameters e.g. temperature of the melt at the extruder die, pressure at the die and torque were measured as well.
From the residence time distribution the mean residence time was calculated. Residence time distribution was obtained by measuring the concentration of a color pigment with a photometric and a colorimetric method. The data of the three independent design-of-experiments were analyzed in an ANOVA and the resulting multi-dimensional regression models where used to calculate the design spaces which are compared for their overlap between the different scales of the extruders.
Material and Methods
Material
Soluplus® is used as a polymeric carrier. It is a polyvinylcaprolactam – polyvinylacetate – polyethylenglycol graft copolymer (BASF SE, Ludwigshafen, Germany) with an amphphilic structure which was developed specifically for increasing the solubility of poorly soluble substances via the HME process.
Ferric trioxide is used as a tracer, because of its intensive red color.
Parallel, co-rotating twin screw extruders
Three different sizes of parallel twin screw extruders are used to simulate the scalability of the HME process: As a labscaleExtruder a Pharma 11, for medium scale a Pharma 16 and for production scale a Process 24 (Thermo Fisher Scientific, Karlsruhe, Germany) are used. The index describes the screw diameter. All barrel have a length of 40 L/D.
The settings were varied to a minimum, mid point and maximum value for the screw speed (100 rpm, 300 rpm and 500 rpm), the temperature program (130 °C, 165 °C and 200 °C) and the feed rate (shown in TABLE 1).
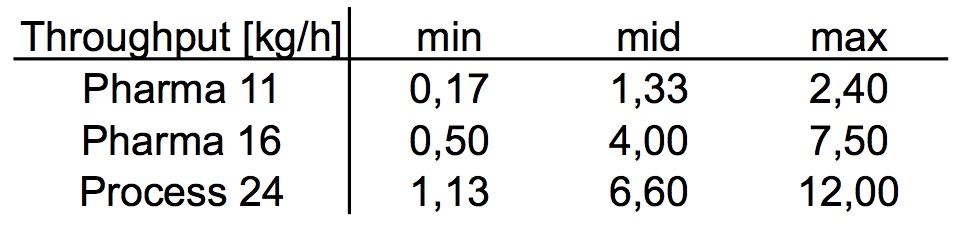
TABLE 1: Different feedratesused on a different twin screw extruder sizes
The feed rate for the different extruder sizes is calculated in dependence on the equation of Schuler (EQUATION 1) [3].

EQUATION 1: Empirical equation of Schuler
For all the experiments the screw setup was kept constant with two mixing sections, like shown in FIGURE 1.
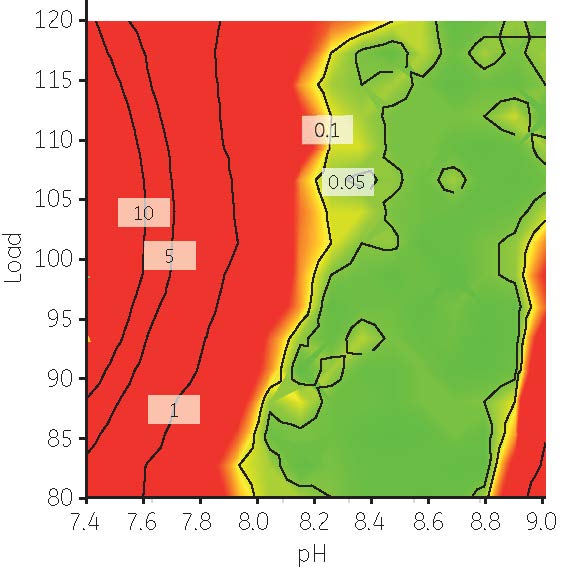
FIGURE 1: Set up of screws and barrel used for the scale up experiments on the Pharma 11, Pharma 16 and Process 24. At the feeding section the Soluplus® is added as well as the pigment is added at a given time T0. The degassing section at the left hand side is an atmospheric degassing to allow water vapor to evaporate out of the polymer
Measurement of the residence time
The pigment is added as a tracer to the hopper of the feeding section at a given time T0. The color concentration is measured at the die over the time.
Picture method: a picture of the strand is taken every 0.2 sec. On every picture a defined size of strand is detected regarding the amount of red pixel (FIGURE 2)
IR method: ExtruVis 2 is a colorimeter, developed by A. Gryczke. It is measuring in line the concentration of the pigment in the melt at the die exit.

FIGURE 2: Residence time distribution measurement set up
Software for Data Analysis
Visual X-Sel 11.0 (CRGRAPH, C.U. Ronniger, Germany) with a Design of Experiments (DoE) modul is used for planning the experiments. For calculation the prediction a modul for multi-dimensional regression modelsis used. The optimization of the calculation was done with MS Excel 2010 (Microsoft).
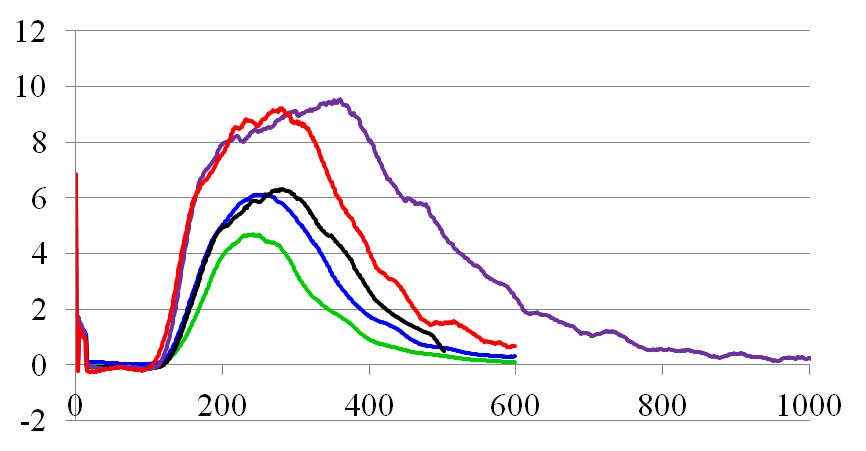
FIGURE 3: Influence of tracer concentration:
green curve: 0.1 g, blue curve: 0.2 g, black curve: 0.3 g, red curve: 0.5 g and purple curve 1.0 g of tracer were added to the Pharma 16 with constant parameter and constant feed rate.
Results
To have a successful scale up, it is required to have the same experience for the material on the lab scale extruder as on the bigger, production scale extruder. Therefore it is assumed that the residence time of the material within the extruder must be the same, to allow melting and mixing on one hand and to avoid degradation on the other.
Especially when working with very low feed rates, it needs to make sure that there is no influence of the tracer itself on the process and therefore on the measurement of the residence time distribution. If we are thinking about the low feed rates of the lab scale 11 mm extruder, where we have only 0,17 kg/h, that means, that every second less then 50 mg is fed into the extruder. When then the amount of tracer is too high then the value for the feed rate will be higher at that moment the tracer is added and therefore also all the other parameters depending on the feed rate will change as well. So it is easy to imagine that the amount of the tracer can have an influence. To determine the influence of the tracer concentration, with the same process settings were measured the residence time distribution with different amounts of tracer (FIGURE 3).
Obviously with increasing amount of tracer the distribution gets broader and the mean residence time shifts to higher values. Therefore there should be always used a very small amount and to get comparable results also always the same concentration of tracer.
For the scale up experiments at first, the feed rate was only calculated by the equation of Schuler. As shown in FIGURE 4 the throughput was increasing from 1 kg/h to 3 kg/h according to this equation when changing from a 11 mm screw diameter to an extruder with 16 mm.
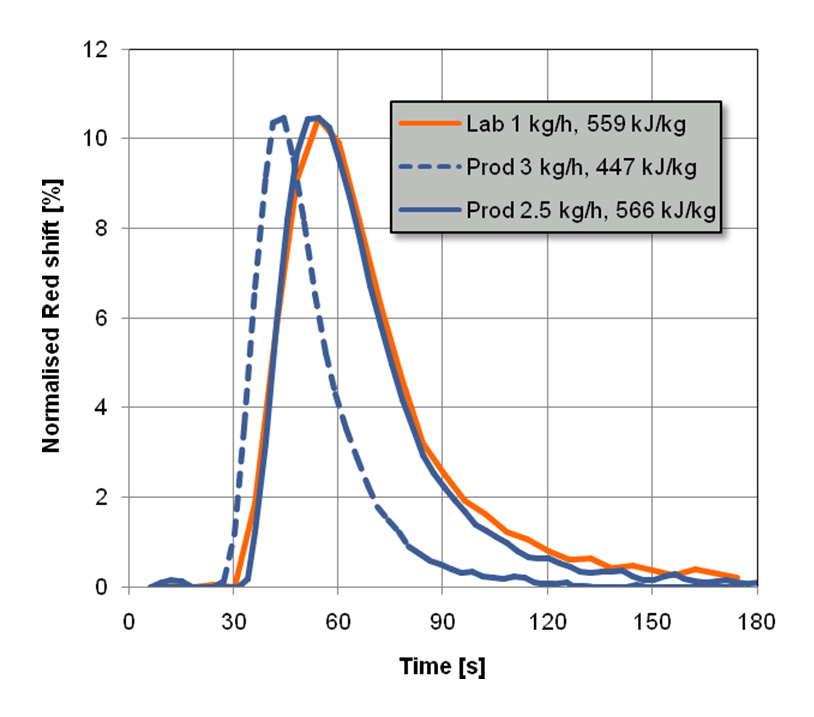
FIGURE 4: Influence of feed rate and SMEC on the residence time distribution
Orange curve: Lab scale extruder (11 mm)
Blue curves: middle size extruder (16 mm)
continuous line: feed rate calculated by Schuler
Dotted line: feed rate adjusted regarding SMEC
When increasing the feed rate by Schuler the residence time distribution on the next scale extruder is very similar. Nevertheless the distribution is narrow than the distribution of the lab scale extruder and slightly shorter as well. It was found that the residence time distribution is matching perfectly when matching the specific mechanical energy consumption (SMEC) [4].
The SMEC is calculated by the torque, the screw speed and the feed rate, like shown in EQUATION 2. While the screw speed and the throughput are parameters which can be set individually the torque is a resulting value. Therefore the SMEC needs to be adjusted by adjusting the feed rate.
τ: torque [Nm], n: screwspeed [rpm], ṁ: throughput [kg/h]
EQUATION 2: Calculation of the specific mechanical energy consumption (SMEC)
In the next step the knowledge space of the used extruder sizes is explored with an DoE. Then an ANOVA (analysis of variance) was performed and the design space was described via multiple regression. Therefore the design space of all the other sizes could be calculated.
The regression model was used to calculate the design space from the 11 mm lab scale to the 24 mm production scale. The regression model was matched regarding residence time, melt temperature and SMEC. The results are shown in FIGURE 5.

FIGURE 5: The design space of different sizes twin screw extruder, calculated from the 11 mm scale extruder via regression model
For the scale up from the design window of the Pharma 11 to the Pharma 16, only the feed rate need to be adjusted to the bigger size. In case of the scale up to a 24 mm system the feed rate needs to be adjusted of course, but also the screw speed needs to be increased as well.
What could be shown here is limitation of the scale up process. When increasing the extruder equipment, than the surface area will increase by the power of two. While when the feed rate increases, than this volume will increase by the power of three. So, with increasing extruder size, the ratio between the surface area to introduce heat and cooling energy to the system to the volume of the material is getting smaller. This is why additional energy needs to be added by increasing the screw speed. Also the design space windows are growing with increasing scale up steps.
Another effect which could be shown in this study is the correlation of the SMEC with the degree of filling of the extruder (FIGURE 6).
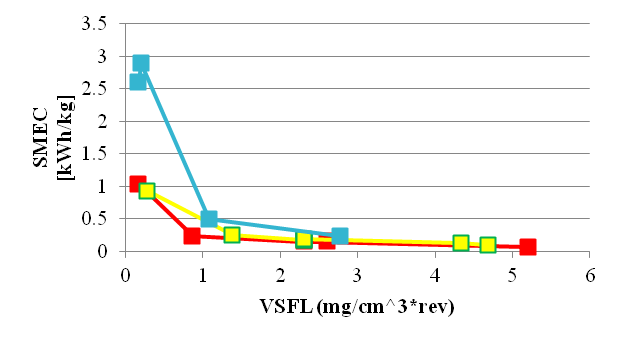
11mm
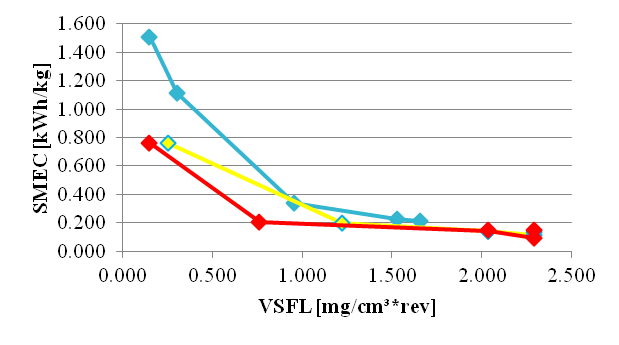
16mm
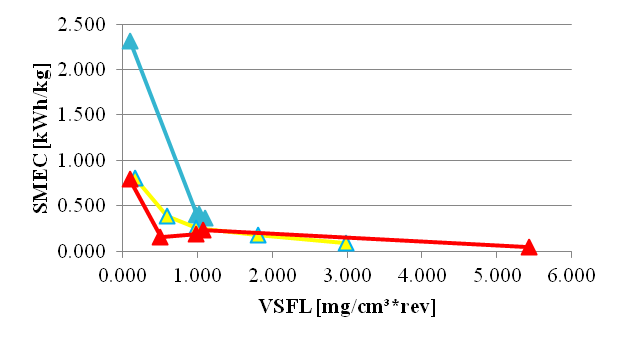
24mm
FIGURE 6: Overview of the correlation between the VSFL and the SMEC. Shown are the figures from Lab to Line equipment (left upper corner the 11 mm, right beside this the 16 mm and in the lower row the 24 mm extruder).
The different colors are linked to different barrel temperatures: Blue curve: 130 °C, yellow: 165 °C and 200 °C is shown in red
All these effects can be explained by the equation of the SMEC. With increasing feed rate and therefore increasing VSFL there is a decreasing mechanical energy input, because more material share the mechanical energy which is supplied by the system. Another point which is also very important is that with increasing barrel temperatures the SMEC is decreasing. Actually with increasing barrel temperature the viscosity of the material will decreasing, therefore also the torque will decreasing. And compared to EQUATION 2, with decreasing torque the SMEC will decreases as well.
Conclusion
For each of the three extruder scales a design space could be calculated based on the residence time distribution and the specific mechanical energy consumption.
It could be shown that the residence time distribution and the specific mechanical energy consumption are crucial parameters for an successful scale-up of an pharmaceutical melt extrusion process.
It could be shown the amount of tracer influences the residence time distribution measurement.
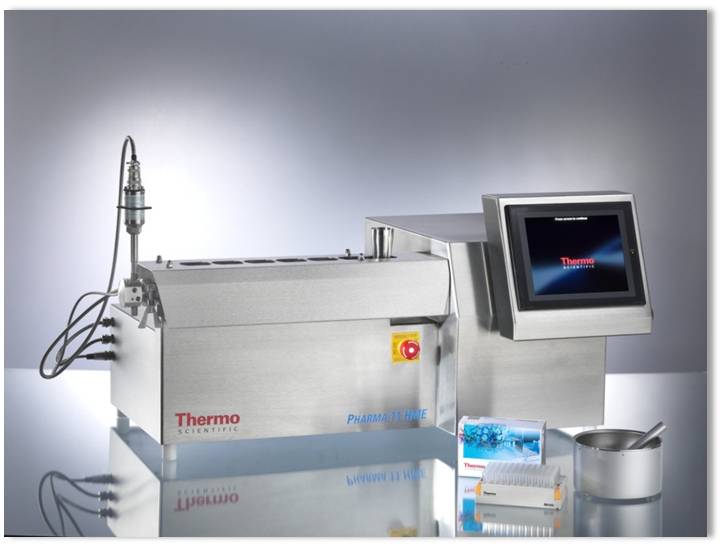
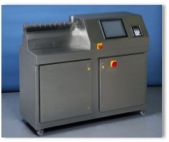
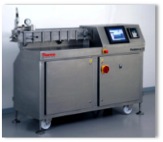
Overview of Parallel Twin screw Extruders (from the left to the right Pharma11 with 11 mm, Pharma 16, with 16 mm and Pharma 24, with 24 mm screw diameter)
To learn more visit: http://www.thermoscientific.com/en/products/extruders.html
References
[1] Breitenbach, J.: Melt extrusion, from process to drug delivery technology, European Journal of Pharmaceutics and Biopharmaceutics, 2002
[2] Douroumis, D.: Hot melt Extrusion – Pharmaceuticalapplications, Willey 2012
[3] Bogun, M.: Untersuchungen zur kontinuierlichen Herstellung von
Kautschukmischungen basierend auf Rubber/Filler-Composites
am Doppelschneckenextruder, Thesis Hallee Germany, 2005
[4] Kohlgrüber, K.: Der gleichläufige Doppelschneckenextruder, Carl Hanser Verlag, 2007
Acknowledgements
This work was performed in collaboration with the BASF. In this collaboration the BASF and Thermo Fisher Scientific are working close together to investigate the dependency and influences of process parameters in Hot Melt Extrusion Processes. Also the link between Rheology and HME is investigated.
Especially to understand the process and the way to scale up HME processes are focus of this work.
Originally presented at 2013 Annual Meeting American Association of Pharmaceutical Scientists
Related Topics and Keywords
amorphous, Amorphous Solid Dispersions (ASD), co-rotating twin-screw compounder, Crystalline, drug development, formulation development, HME, Hot melt extrusion, Hot Melt Extrusion (HME), lab scale extruder, manufacturing, pharmaceutical dosage forms, polymeric drug carrier, poorly soluble drugs, residence time distribution, SMEC, solid dispersion, solid dispersions, specific mechanical energy consumption, specific mechanical energy consumption (SMEC), twin screw extruders
Subscribe to our FREE newsletter and WEBINAR UPDATES
We will not sell or give your information to a third party. See our Privacy Policy